Can you predict tomorrow's weather using the same tools a meteorologist uses? Five instruments each measure a different piece of the puzzle:
- thermometer (temperature)
- barometer (air pressure)
- wind vane (wind direction)
- anemometer (wind speed)
- hygrometer (humidity)
You take daily readings with all five for two to three weeks. You also track weather reports from TV or the National Weather Service. Then you combine your data with information about fronts (boundaries between air masses).
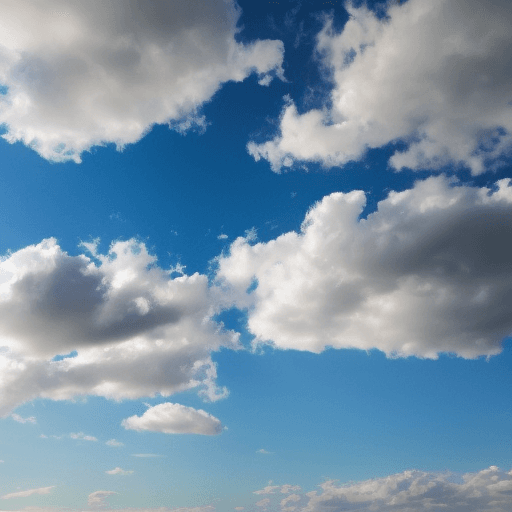
Using your readings, you build weather charts of cold fronts and warm fronts. You map high and low pressure areas. You also learn to identify cloud types by sight.
Hypothesis
The hypothesis is that students can use meteorological instruments to measure the current weather conditions and make weather charts.
Temperature tells you how hot or cold the air is at a given moment. Tracking it over time reveals patterns that help explain larger weather changes. In this experiment, a "thermometer (temperature)" joins four other instruments to build a daily picture of conditions.
Among the five instruments you use in this project, the anemometer tells you how fast air is moving each day. Paired with readings from a thermometer, barometer, wind vane, and hygrometer, it gives you one piece of the larger puzzle a meteorologist assembles to predict tomorrow's weather.
An anemometer captures one piece of the weather puzzle: wind speed. Its spinning cups translate the force of moving air into a number you can record and track. Reading it daily alongside a thermometer, barometer, wind vane, and hygrometer builds a dataset that reveals how wind speed connects to approaching fronts and pressure changes.
Air pressure is the push of air on everything around it, and mapping where that push is strong or weak helps predict weather. A barometer captures daily readings of that pressure. Over two to three weeks, you build weather charts of high and low pressure areas to see how shifting conditions shape what happens locally.
Air pressure is one piece of the forecasting puzzle, and a barometer is how you measure it. Over two to three weeks, you map high and low pressure areas using daily readings from five instruments. That data, combined with information about fronts — the boundaries between air masses — lets you build weather charts.
Method & Materials
You will use a thermometer, barometer, wind vane, anemometer, and hygrometer to take measurements of the current weather conditions each day for two or three weeks.
You will need a thermometer, barometer, weather vane, anemometer, weather charts, hygrometer, and paper and pencil for notes.
Tinker Crate — science & engineering build kits for ages 9–12 — real tools, real experiments, delivered monthly. (Affiliate link)
After taking measurements of the current weather conditions for two or three weeks, students can make weather charts of cold and warm fronts, high and low pressure systems, and cloud types.
Why do this project?
This science project is interesting and unique because it allows students to learn how to use meteorological instruments to measure the current weather conditions and make weather charts.
Also Consider
Experiment variations to consider include using a recording barometer instead of a regular barometer, and using a weather satellite to measure the current weather conditions.
Full project details
Additional information and source material for this project are available below.