| Complexity level: | 5 |
| Time required: | You will need time to set up your food samples, make daily observations of your food samples for one week, then graph and analyze your results. |
| Material availability: | The materials needed for this lab can be found at home. |
| Safety concerns: |
Overview
What do penicillin, pizza, and athlete's foot all have in common? What grows on bark, dead caterpillars, bird's nests and your feet? What makes fairy rings, giant puffballs and is farmed by termites? What's microscopic, gets carried by wind, gives rise to fruiting bodies and makes you sneeze? Do you think these things have nothing in common? Guess again. Fungi. Yes, fungi are everywhere, even when you don't actually see them. Indeed, "there is a fungus among us."
Puffballs are fruiting bodies of fungi that contain spores, which get carried away by wind, hence the term "puff". The spores are akin to plant pollen and have reproductive purposes. In some cultures, caterpillar fungus, a fungus produced from a dead caterpillar, is used as traditional medicine for stress relief. In some countries, particularly in Europe, it's a common tradition to go foraging for mushrooms, truffles or morels. If you are curious and want to perform this activity yourself, make certain that you get the advice of an expert before handling or eating any mushrooms you have collected. Some mushrooms are very poisonous, and while they are often bright colors, (such as a bright red) this is not always the case!
Fungi have been found to possess many beneficial characteristics. Penicillin was the first antibiotic to be discovered and is still a widely used medicine today. In addition to fungi with antimicrobial properties, there is ongoing research on fungi that have been found to possess anti-cancer and anti-diabetic properties. Fungi, specifically the single-celled yeast, have been used in baking to make bread rise, as well as in the process of fermentation for making beer, wine and other forms of alcoholic beverages.
Fungi are classified in their own kingdom of living organisms because of their many unique properties. For one, fungi can be single-celled and multicellular organisms. They have chitin in their cell walls, unlike plants and protists, which contain cellulose. Chitin is a unique compound also found in insect exoskeletons. Fungi typically go unnoticed because of their small size and frequently form symbiotic relationships with plants and other organisms. Symbiosis is a mutually beneficial relationship between two different types of organisms . Lichens are an example of a symbiotic relationship between fungi and algae. Fungi also form symbiotic relationships with plant roots called mycorrhizae, in which the fungi supply the plant with needed nutrients and the plant provides the fungi with carbohydrates.
Fungi are often detritivores, which means that they consume dead and decaying material. This is the reason that fungi, usually mold, will appear on food that has gone bad. If you have seen mushrooms when you're out on a hike or observed where mold grows in your home, you may begin to identify what all these places have in common. Fungi prefer particular temperatures, moisture and light levels. In addition to that, there are particular substrates that fungi prefer, such as wood. A substrate is a growing surface. In this science project, you are going to determine what kind of substrate/food in your home provides the best growing conditions for mold.
Scientific Terms
Materials
Food samples from your home that are no longer fresh/needed, such as:
- one or two types of fruit
- one or two types of vegetables
- Bread
- coffee grounds
(Note: you only need a small piece of each food type and do not use meat.)
- Sandwich bags
- paper/pencil to record data
- camera if available or sketch pad
- ruler
Procedure
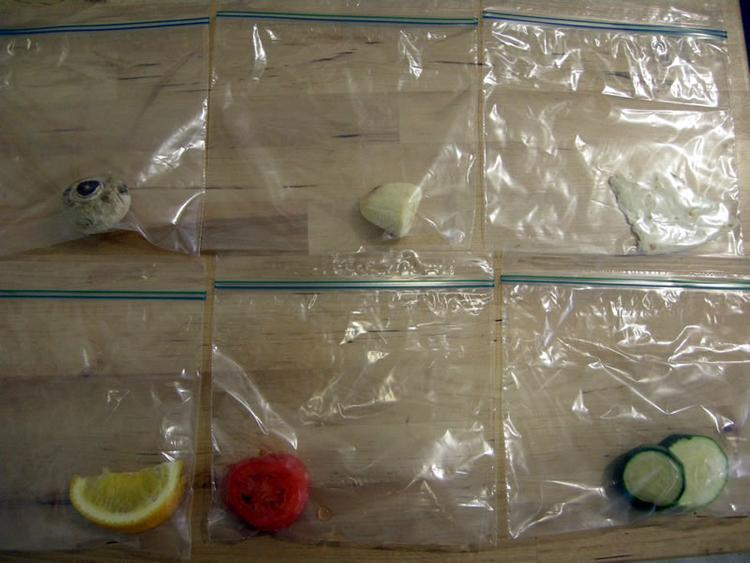
1) Choose five different types of food to test for their suitability as a surface for mold growth. Choose a variety of foods, such as 1-2 fruits, 1-2 vegetables, dairy and bread.
2) Place your chosen foods in plastic sandwich bags in order to retain the natural level of moisture of the chosen food. Find a safe spot in your home to leave the bags for the duration of the experiment, such as a cupboard or high shelf. Remember to keep your project away from little siblings and curious pets!
Note: Keep all the bags together. For this science project, we want growing conditions for all chosen foods to be the same. Light levels, moisture, and temperature in your chosen location will have an effect on mold growth and should be the same among all samples, so that the only variable is food/substrate type.

3) If you have a camera, take a picture of the bags on day 1. Record any observations, such as bruising already present on the food.
4) Repeat # 3 for an entire week and use the provided data table to record your observations. If mold is present, use a rule or tape to measure the diameter (if it's circular), or its length and width. Use the metric system to measure if possible (centimeters, rather than inches).
If the growth is circular, use the area of a circle to calculate growth (Acircle=n*r2). If the growth is rectangular, use Arectangle=length*width and for a square use Asquare=side2. See attached table.

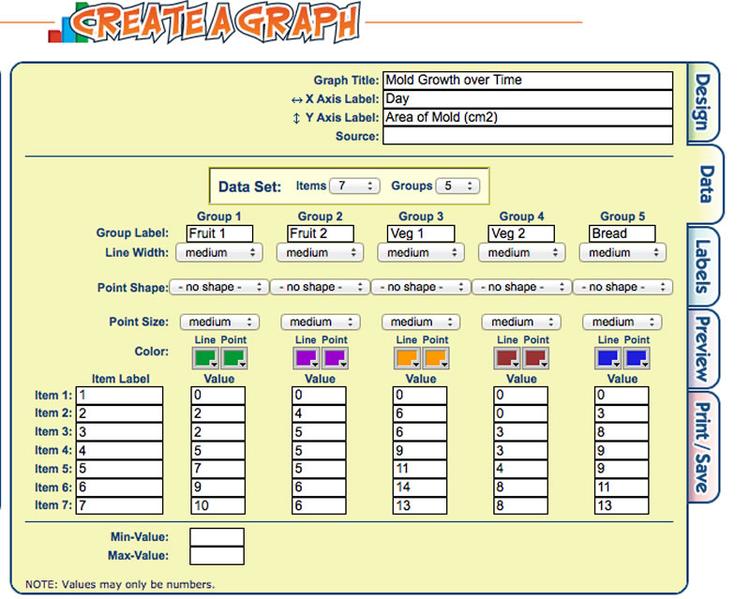
5) In order to compare the suitability of each food type for mold growth, plot the mold area (Y) over time (X). Use the website Create-a-Graph if you do not have Microsoft Excel (http://nces.ed.gov/nceskids/createAgraph/default.aspx). To plot your data in Create-a-Graph, choose "line graph" on the design tab. To enter your data, click on the data tab. See the attached screenshots for an example of how to fill in the data labels and values. When finished, click on the preview tab to check that you entered your data correctly, then click on print and save to download the graph.
|
Day |
1 |
2 |
3 |
4 |
5 |
6 |
7 |
|
|
Fruit 1 |
Mold color |
|||||||
|
Mold area |
||||||||
|
Fruit 2 |
Mold color |
|||||||
|
Mold area |
||||||||
|
Vegetable 1 |
Mold color |
|||||||
|
Mold area |
||||||||
|
Vegetable 2 |
Mold color |
|||||||
|
Mold area |
||||||||
|
Bread |
Mold color |
|||||||
|
Mold area |
Table 1. Mold growth data table.

Graph 1: Example of graph created in Create-a-graph.


References
Map of mold spore distribution for United States:
http://www.weather.com/maps/activity/allergies/usmoldspores_large.html
Fun facts on spore dispersal:
http://herbarium.usu.edu/fungi/funfacts/Dispersal.htm
Create-a-graph website:
http://nces.ed.gov/nceskids/createAgraph/default.aspx

