| Complexity level: | 4 |
| Project cost ($): | 10 |
| Time required: | It will take an hour to set up the experiment, and 3 days to conduct it. |
| Material availability: | The materials required can be purchased at a supermarket or bookstore |
| Safety concerns: | None |
Hypothesis
Areas that see a high levels of activity and traffic such asthe marketplace, the bus station and hospitals have a higher pollution level than areas that have low levels of traffic.
Overview
Air pollution
When air is polluted, it means that there are many unwanted particles and substances in the air. These are called pollutants. Some common sources of pollutants are: construction sites, heavy automobile traffic, agriculture, power generation plants and factories. Although some pollutants do not directly affect us, they can react with other substances in the air and become harmful.
Air pollutants exist in the form of gasses and particles. These are common gas pollutants: carbon monoxide, nitrogen dioxide, sulfur dioxide, methane gas, ammonia and volatile organic compounds. Most air pollutants are released by the process of fuel combustion that occurs in the engines of cars, trucks and other vehicles, including airplanes.
In the last decade, there has been an alarming rate of increase in air pollution, and this constitutes a serious threat to public health and to the environment. Air pollution can cause people to suffer from various ailments such as breathing difficulties and frequent asthma attacks. The environment has also been very adversely affected by problems such as ozone layer depletion, higher levels of acid rain and ocean acidification, and global warming.
Scientific Terms
Materials
The materials required for this science project are as follows:
- 8 pieces of cardboard that are of the dimensions 295mm x 210mm
- a pair of scissors
- 1 roll of transparent masking tape
- 8 pieces of wood that are 1.5 meters long each
- 16 nails
- 1 hammer
- 1 measuring tape
- 1 ruler
- 1 microscope
- 1 marker pen
- a sheet of graph paper
Procedure
1. For this experiment, the independent variable is the location at which the collection board is placed. It is to be placed at a city park, a school, a market, a city bus station, the city hall, a hospital, a building top and at home. The dependent variable is to be the number of the particles that the board traps. Count how many particles are trapped using a microscope. The constants (control variables) are to be the relative amount of traffic each area experiences (ie: for example, do not visit one area on a busy day, and another on a quiet day.), the weather conditions in each area (wind direction, sunshine or rain), and the height and size of the collection board.
2. Cut a 5cm x 5cm opening or window in the middle of the pieces of cardboard. Place a layer of masking tape on 1 side of each piece of cardboard. The sticky side of the tape should be visible on the other side of the cardboard. Nail the cardboards to one end of the wooden sticks.
3. The wooden sticks together with the cardboard are to be placed in within the grounds of a city park, a school, a market, a city bus station, the city hall, a hospital, a building top and in a home. The collection boards should be approximately 1m above the ground. Leave the boards undisturbed for 3 days.
4. After 3 days, separate the collection boards and their wooden stands. Place each board is then placed over a sheet of graph paper and view the board under the microscope. Count how many particles found per each square centimeter and record this in the table below.


Results
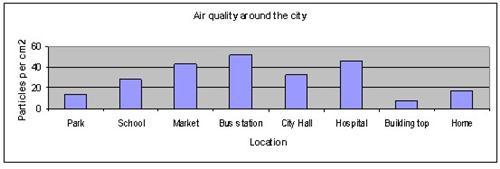
The board placed at the city bus station had the most particles per square centimeter. This was followed by the hospital and the market. The board placed on top of the building had the least number of particles.


Conclusion
The hypothesis holds true: areas that have a high level of activity such as like the market, the bus station and the hospital had a higher pollution level than areas that have a low level of activity.
It is important that everyone works to reduce the level of air pollution in the city. Instead of driving, take public transport. Cars release carbon monoxide, nitrogen oxides and dust particles into the air. When we use public transport or car pool, we cut down on the release of these emissions. We should also use environment-friendly products.
Also consider
Conduct the experiment in other locations. For example, by a highway, at a construction site or at a factory.
Place more collection boards at the same locations.
Also, is there a difference in the quality of air in the vicinity of a suburban home versus one within the city center? What if the home in the city center is near a park, or the wharf?
References
Air pollution - http://en.wikipedia.org/wiki/Air_pollution
FAQ Air pollution - http://www.lenntech.com/faq-air-pollution.htm

